From A to Z
Closed Ended Questions
This particular project was one of those rare opportunities to create something from scratch and see it through. Working in a startup during its growth stage I was luckily given this chance many times - but sometimes the designs didn't make it to production due to new priorities popping up everywhere 😅. The Closed Ended Questions feature was one that I did get to see live from its conception to going live!


The Story
It all started with a recurring customer request from the clients: they needed a way to launch custom questions onto the surveys they set live.
From the beginning they would analyse user sentiment with a series of standard questions provided by us. However, they had no way of adding their own and visualising the qualitative data in a meaningful way.
A word cloud existed on the platform that included a clever NPL to summarise and extract themes from the responses but it was not enough.
They wanted to add custom survey questions and measure the responses.
The Journey
1. Workshop
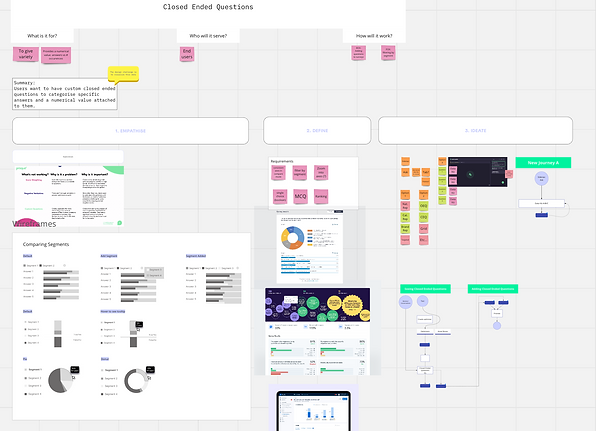
On a Miro board I drafted ideas to workshop with my team. The initial sketches of the data viz were quite straight forwards -the more challenging part was the flow for setting up these survey questions: how do we allow the users to create custom closed ended questions that won't bring junk responses into the data pool?

2. Lo-fi prototype
The next step was for me to go away with the sketches and create a quick prototype that I could preset the Dev and CX team. I designed two different paths to do a quick A/B test and decide on which was more intuitive and comfortable to use.

3. Dev + Design iteration
The most fun part of the project was definitely the hands-on approach to the design process. Due to my background as a front-end developer I was able to design on the fly and pair code with my dev (who is definitely far more experienced as a coder and very creative too). This made the process so much quicker, with many iterations of the designs that allowed us to launch a very complete MVP done in the space of a single 2 week sprint - and a very busy Figma file.
This meant that the design process was live and ongoing as more changes were incorporated and quickly deployed onto the front end for real life users to test in Beta!
4. Real life Testing
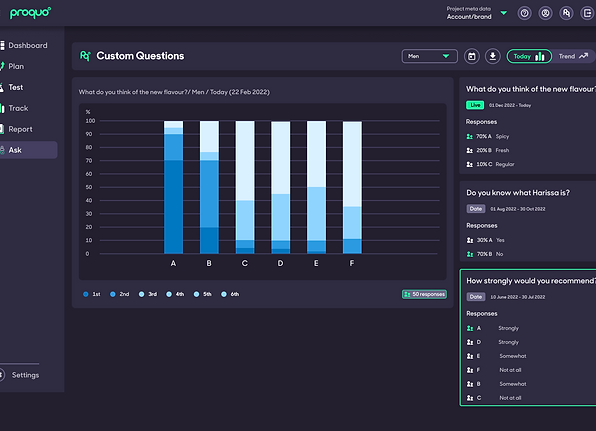
Once the MVP was ready to populate with real life data, the Customer Experience team selected some clients to test it with. A version of the new feature was launched into the production environment with a BETA tag and we just sat and watched it flow in! 🙂
....
Just kidding. We had to closely monitor for bugs, data issues and an endless stream of requests for hot fixes. But at least the designs were not part of this; they remained as released with the only changes being added or editing some logos and icons here and there. This proved that fast iterations was the right decision to make for this piece of work.
Results


The aim of this project was the fulfil a highly demanded customer request, where they could feel their needs were being met and that the feature was of good quality. So at the end of the day, it's up to them to determine the success of the project.
TESTIMONIALS
"Finally! We've been asking for this since December, and it's already making a huge impact on our strategy for Q2"
SCOTT TAYLOR / BRAND MANAGER
"I'm so pleased, very happy about this. I think that I would like to have more contrast between the colours of the bar chart, but that can be solved by having fewer response options per question. Do you think you could add a logo to each of the questions to keep track of the brands?"
EMMA PRICE / INSIGHTS MANAGER
"No way. That was quick! Love it, love it, love it."
STEPHANIE LYNCH/ MARKETING DIRECTOR